Business Challenge
Historical sales data was scattered across multiple spreadsheets, making it difficult to identify long‑term trends, seasonal patterns, or regional performance differences. Strategic planning was hindered by fragmented data.
Consulting Crew Approach
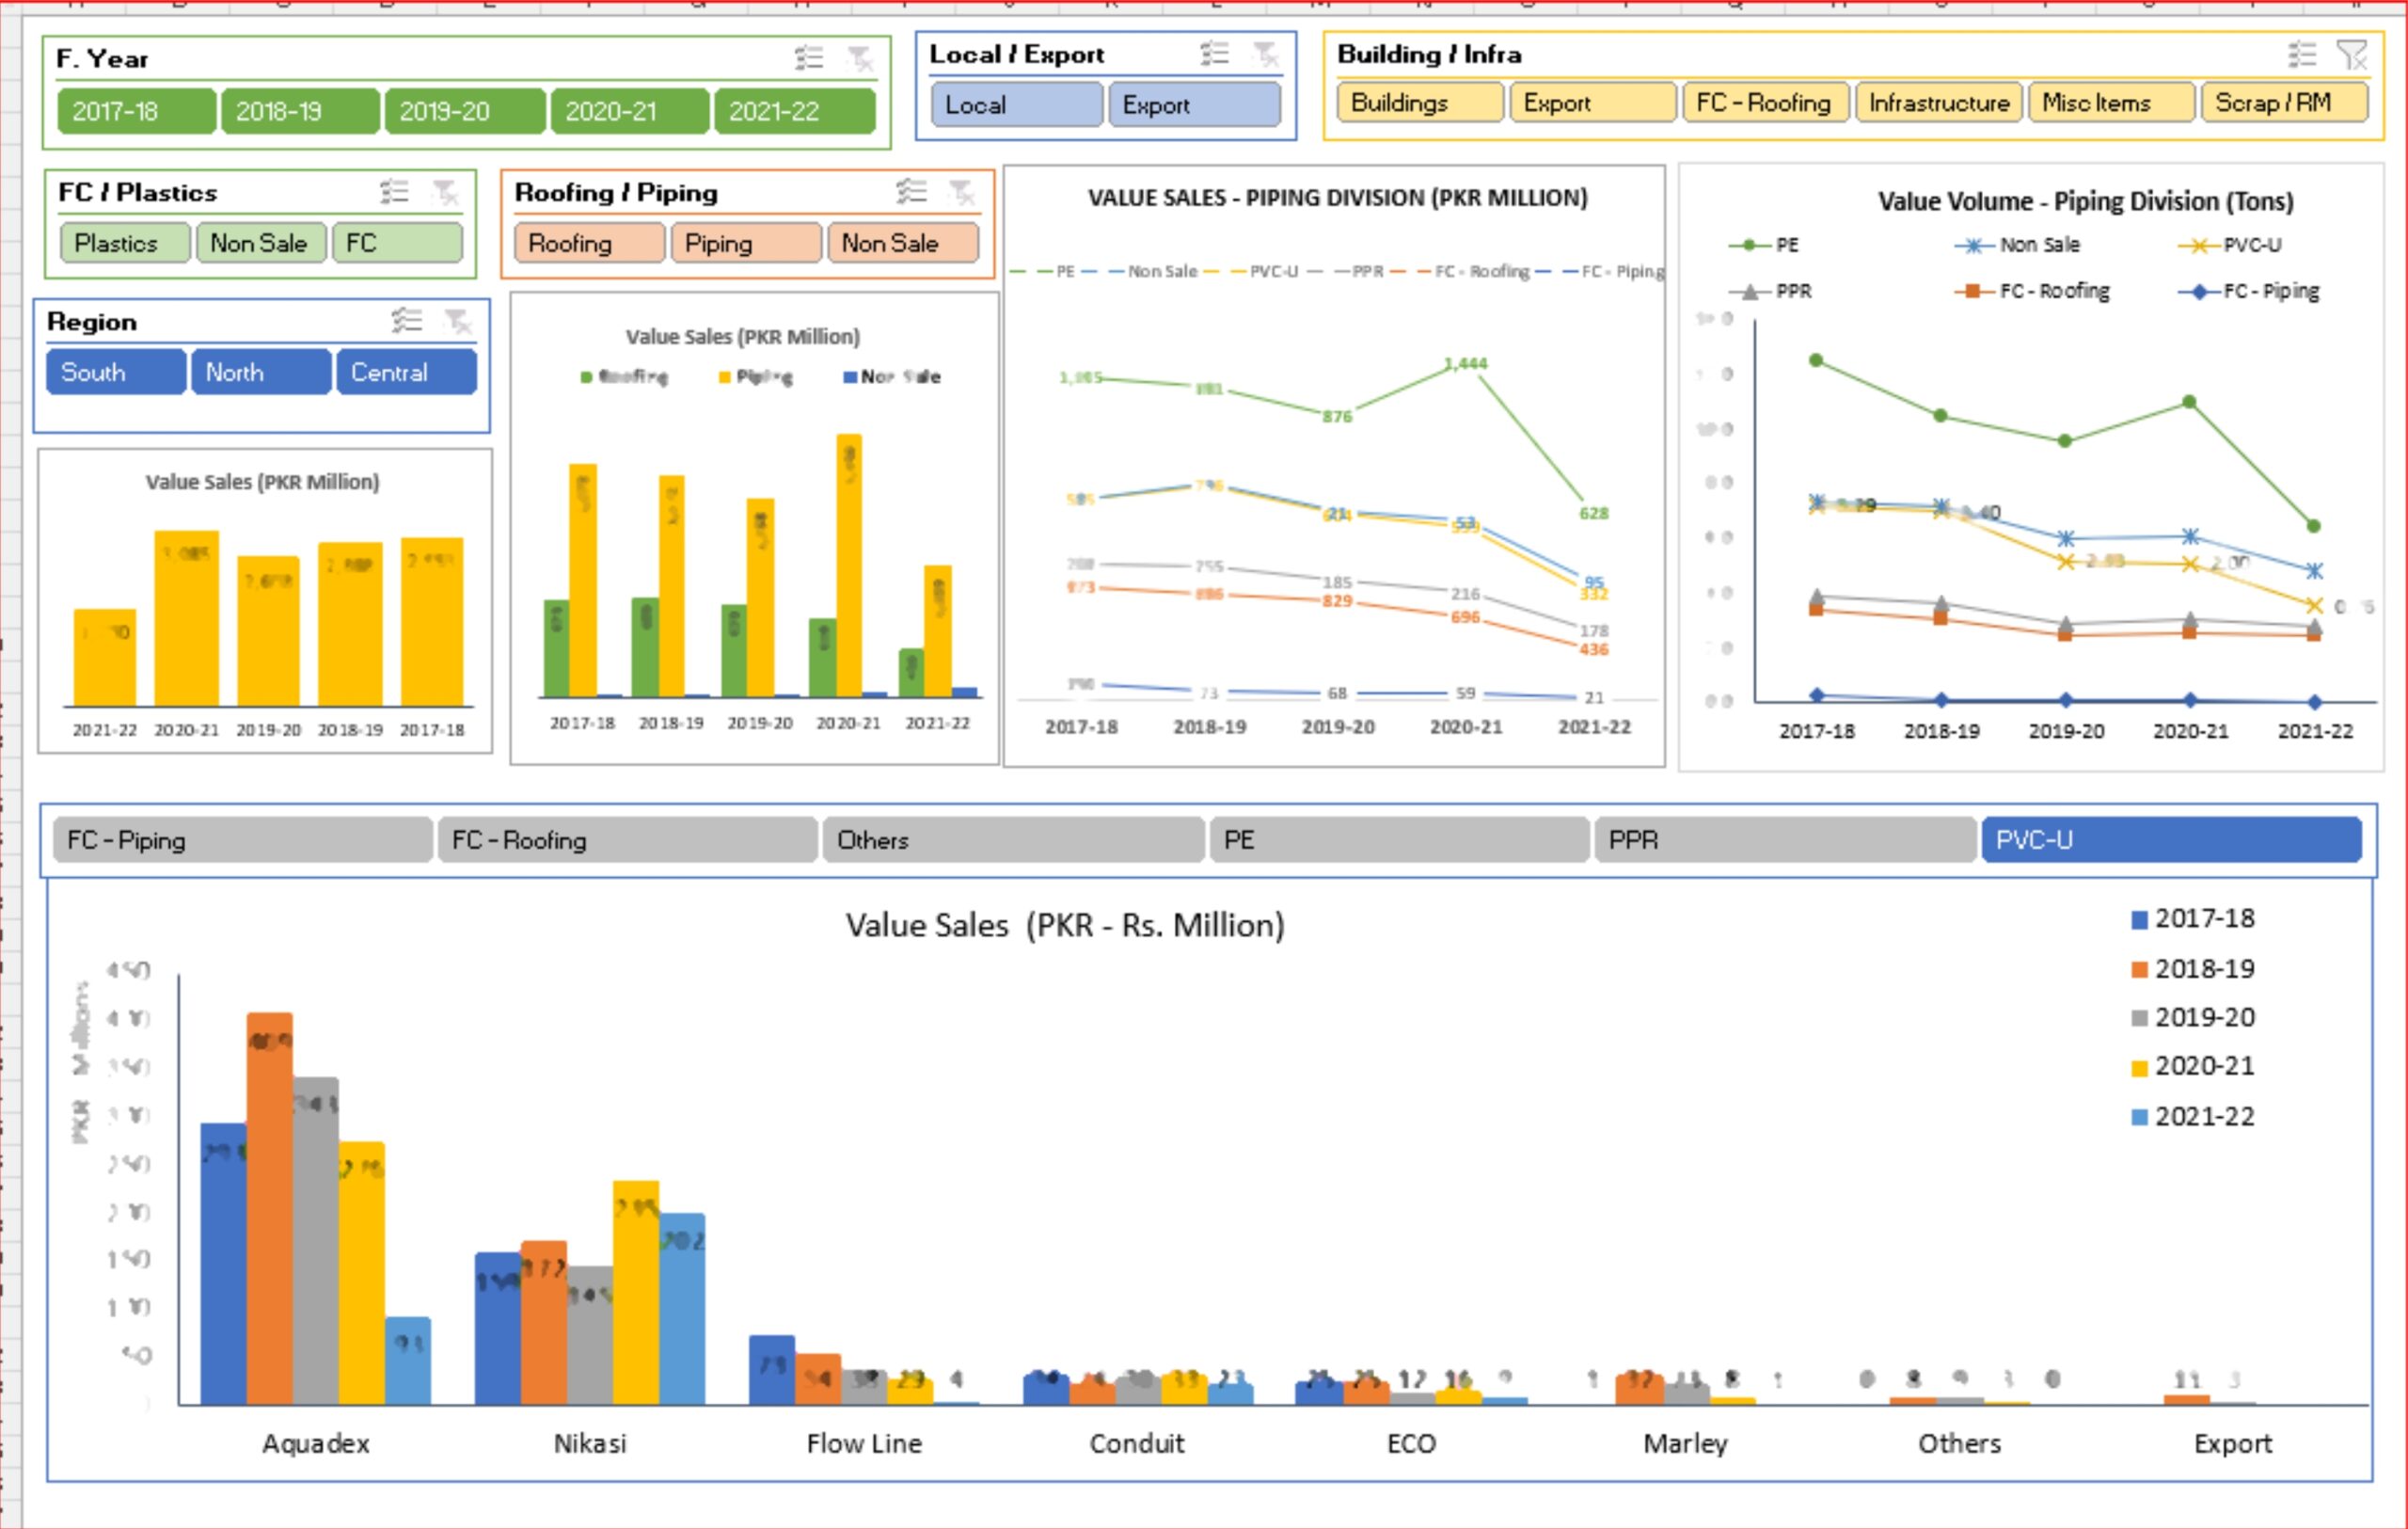
We consolidated 5 years of sales data into a unified dashboard that provides comprehensive trend analysis and strategic insights.
- Historical data consolidation across 5 years
- Regional sales performance analysis
- Product line trend tracking
- Seasonal pattern identification
- Interactive data exploration
Key Dashboard Features
- Year‑over‑Year Trends: 5‑year performance visualization
- Regional Breakdown: Sales performance by geography
- Product Line Analysis: Category‑level performance tracking
- Seasonal Patterns: Identification of recurring trends
- Growth Metrics: CAGR and growth rate calculations
- Interactive Filters: Drill down by year, region, or product
Business Impact
- Strategic Planning: Data‑backed decisions supported by historical trends
- Resource Allocation: Better understanding of regional and product performance
- Forecast Accuracy: Improved predictions based on historical patterns
- Time Savings: Eliminated manual data consolidation efforts