Business Challenge
Sales teams struggled to track Month‑to‑Date (MTD) and Year‑to‑Date (YTD) performance metrics efficiently. Manual calculations and fragmented data sources made it difficult to conduct timely business reviews.
Consulting Crew Approach
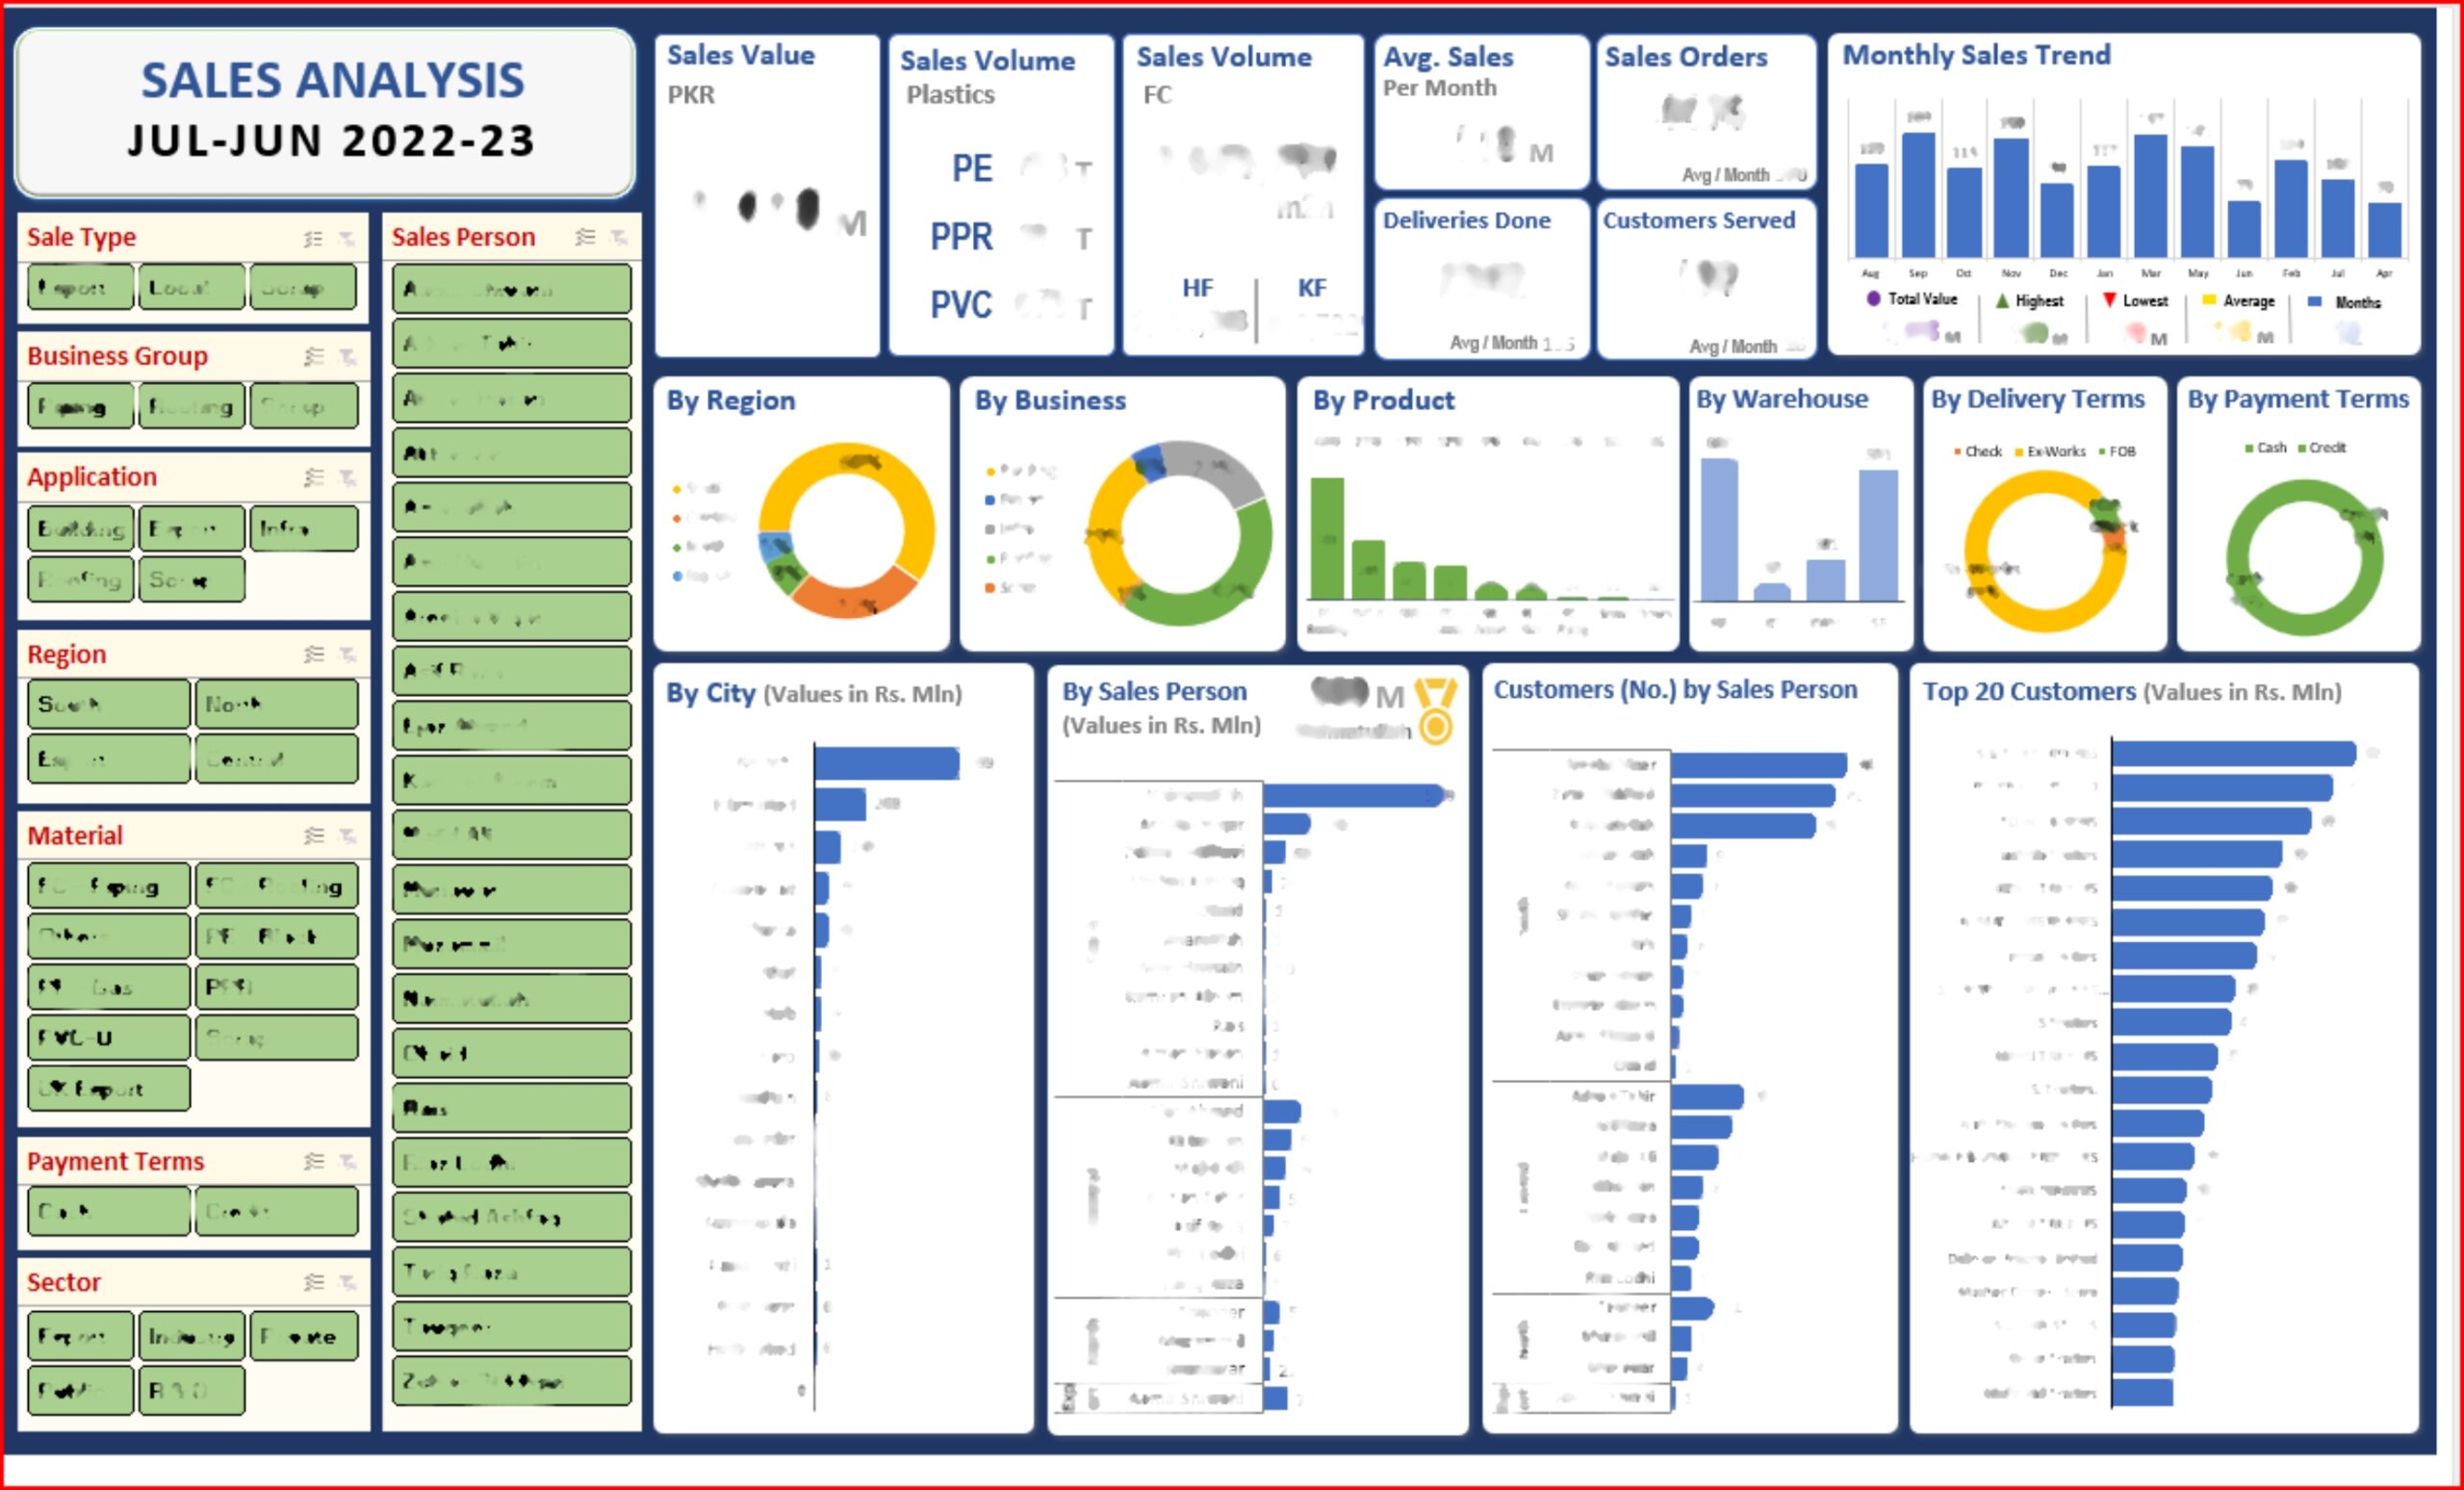
We developed a structured sales dashboard that provides real‑time MTD and YTD metrics with comprehensive breakdowns.
- MTD and YTD sales tracking
- Product‑level performance analysis
- Regional sales breakdowns
- Customer segmentation insights
- Goal tracking and variance analysis
Key Dashboard Features
- MTD Performance: Current month sales vs. targets
- YTD Performance: Year‑to‑date progress against annual goals
- Product Breakdown: Sales by product category
- Regional Analysis: Performance by geography
- Customer Insights: Top customers and growth trends
- Variance Analysis: Performance gaps and reasons
Business Impact
- Faster Reviews: Monthly business reviews conducted in minutes
- Goal Tracking: Clear visibility into progress against targets
- Informed Decisions: Data‑backed adjustments to sales strategy
- Team Alignment: Everyone aligned on current performance